A 3D pie chart that builds itself, for free
Download the templateAn After Effects project where everything sits on one layer. Six sliders for the six slices, one for the build, three for the shape of the ring. The percentages work themselves out from the total, the bars pick up their slice’s colour, and the labels stay square to the camera whatever you do with it.
A 3D pie chart is a tedious thing to build by hand. Every slice is an arc whose angle depends on the others, the percentages have to follow, and the day a client changes one figure you start again. So I built mine once, with expressions that do the arithmetic.
What’s left is a single gesture: type your six values, put two keyframes on one slider, and the chart builds.
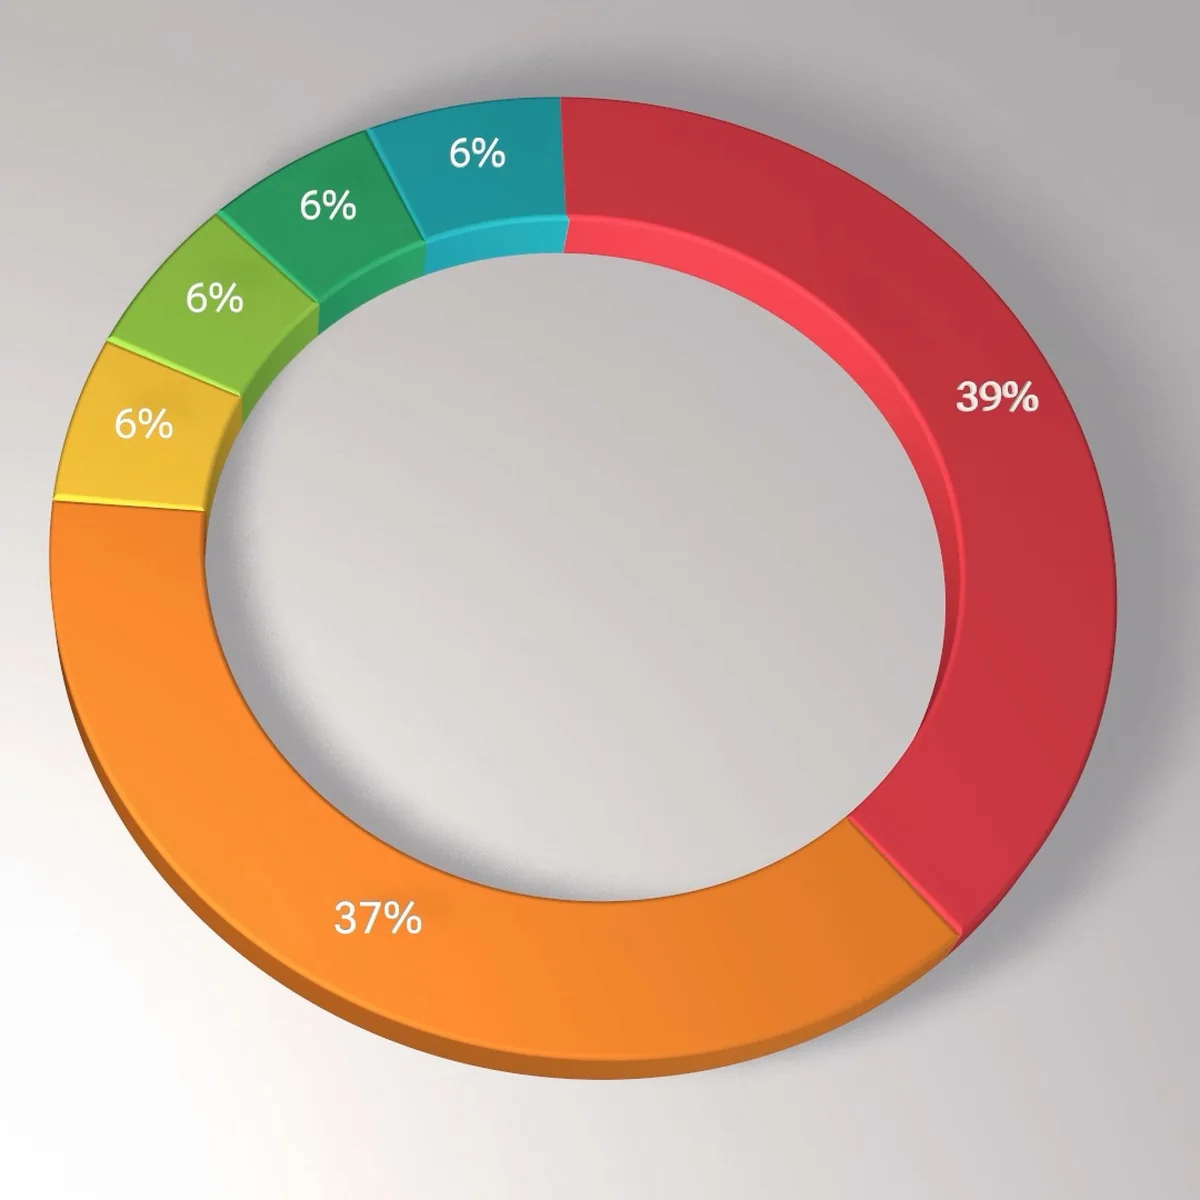
1.5 MB zip: the After Effects project, the example render and a read me in English and French. Free for personal and commercial work.
Everything is on one layer
Open the Pie Chart composition and select the Pie Controls layer. You won’t need to touch another one.
- Slice 1 to Slice 6: each slice’s value, in whatever unit you like. Percentages come from the total, so they don’t have to add up to 100. A slice at 0 disappears, label included.
- Grow: 0 to 100, the build. This is the only slider you need to animate.
- Hole Size: the centre hole, as a percentage of the radius. 0 gives a solid pie, 95 a thin ring.
- Pie Radius: the outer radius.
- Bevel Depth: bevel depth, shared by the ring and the bars.
Colours live on the stroke of each Pie Slice layer. The bars on the left find theirs on their own.
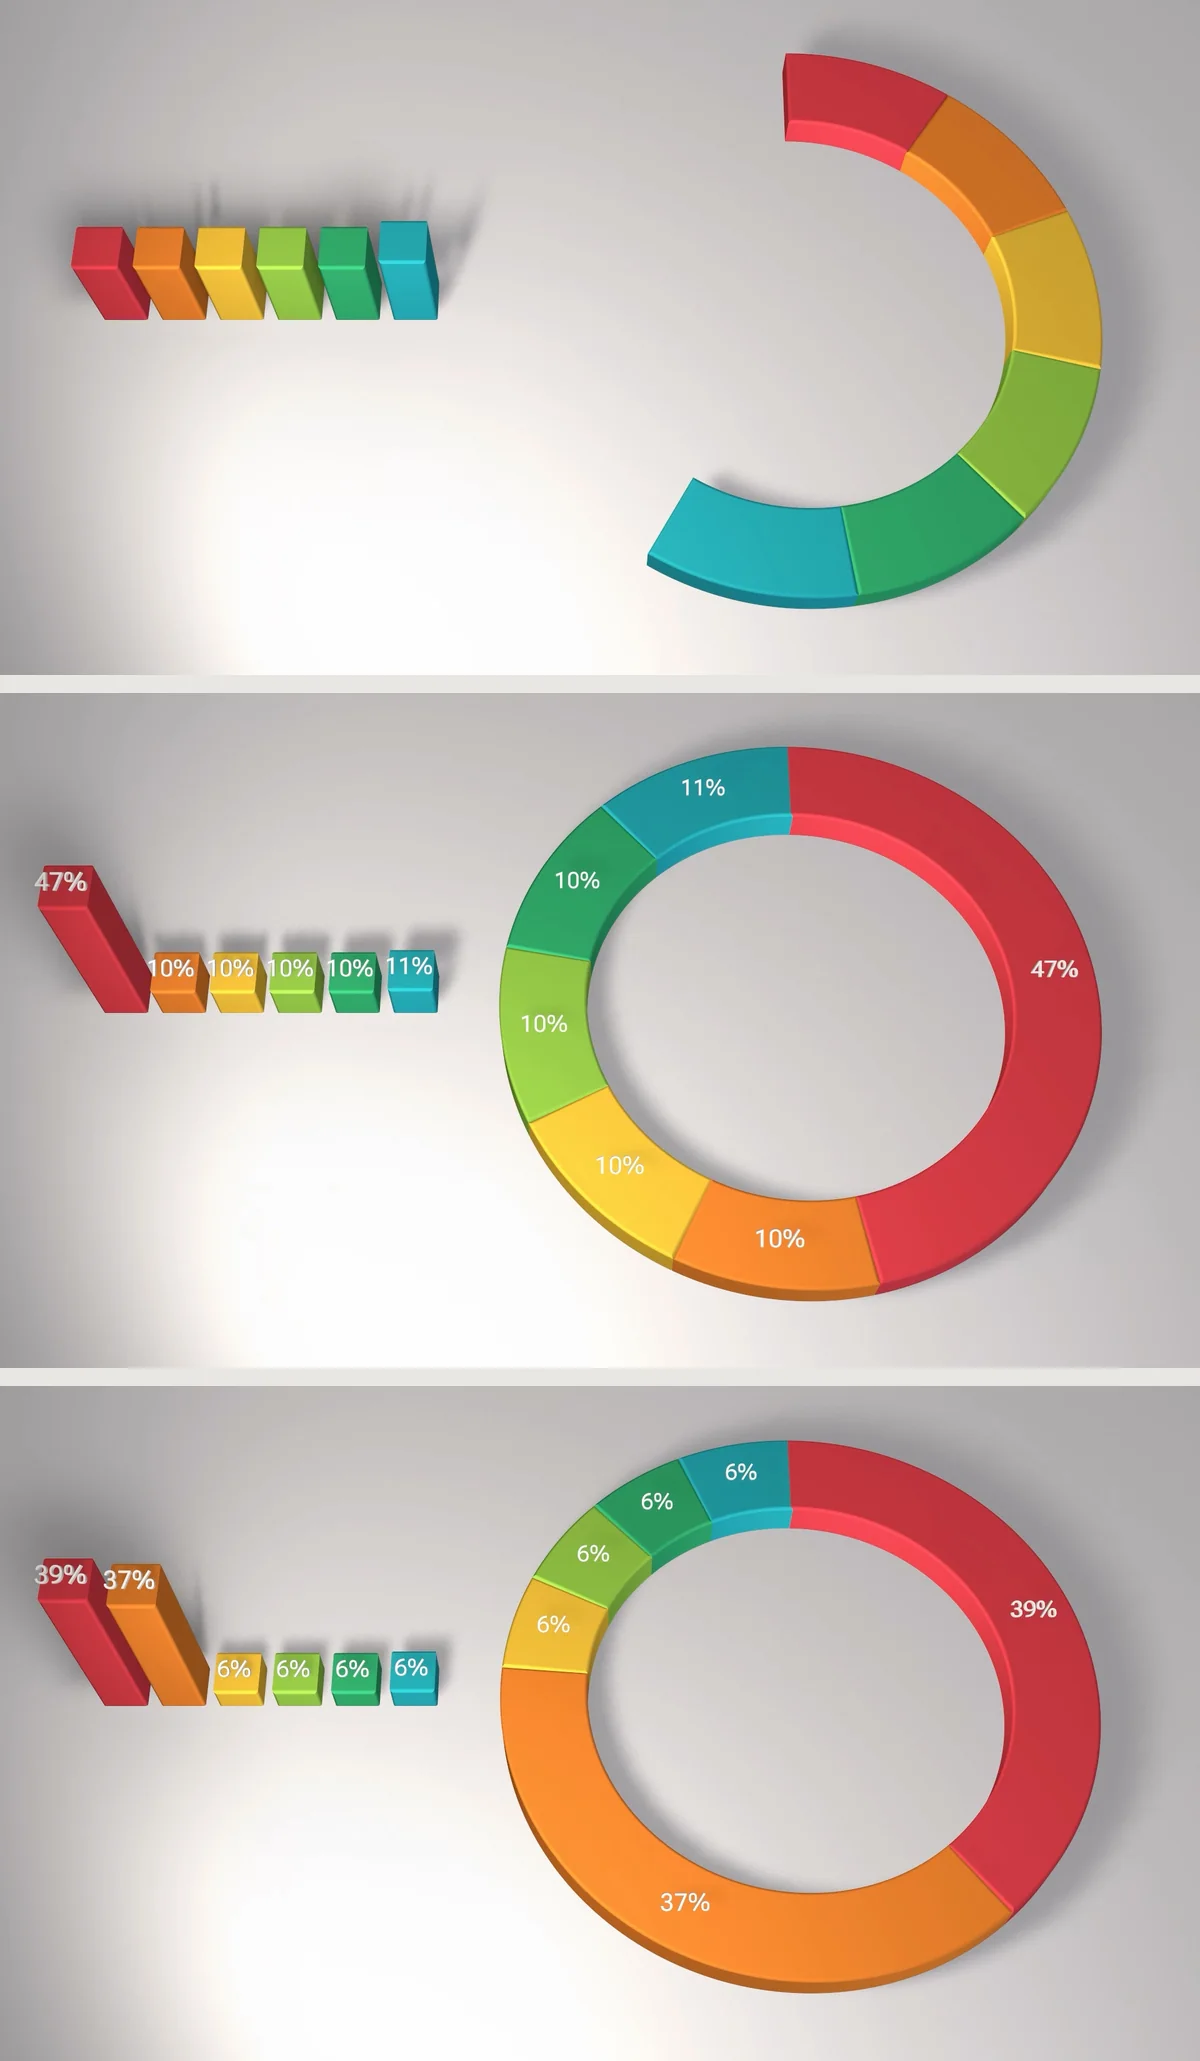
Percentages come from the total
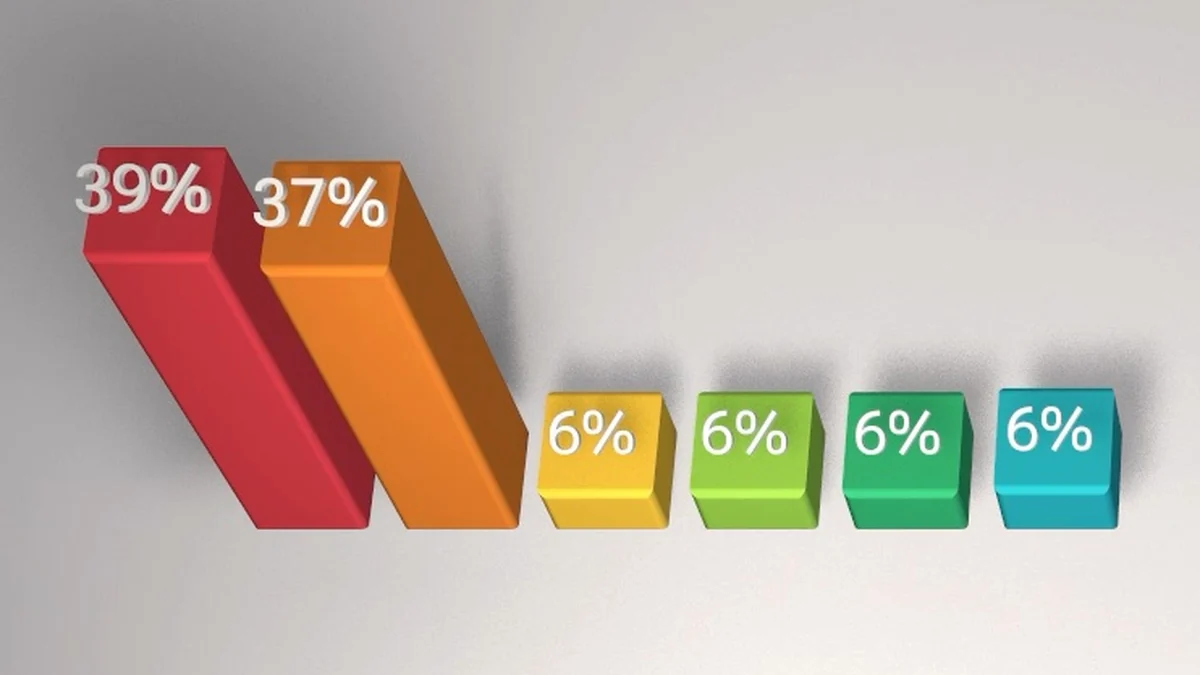
This is the heart of the template, and what saves you typing the numbers twice. Each label adds up the six sliders, then divides itself by that. Type 12, 9, 4, 4, 4, 2 and the template shows 34%, 26%, 11%, 11%, 11% and 6%, with nothing to convert.
Bar Label 1 · Source Text
// Live percentage for this bar
const N = 6; // number of slices
const ctrl = thisComp.layer("Pie Controls");
const idx = parseInt(thisLayer.name.replace("Bar Label ", ""), 10);
let total = 0, own = 0;
for (let k = 1; k <= N; k++) {
  const v = Math.max(0, ctrl.effect("Slice " + k)("Slider").value);
  total += v;
  if (k === idx) own = v;
}
total > 0 ? Math.round(own / total * 100) + "%" : "";
The label reads its own number out of the layer name. That’s why the layers are called Bar Label 1 to Bar Label 6: rename them and the expression no longer knows which slice it is talking about.
The ring is one stroke, not a filled shape
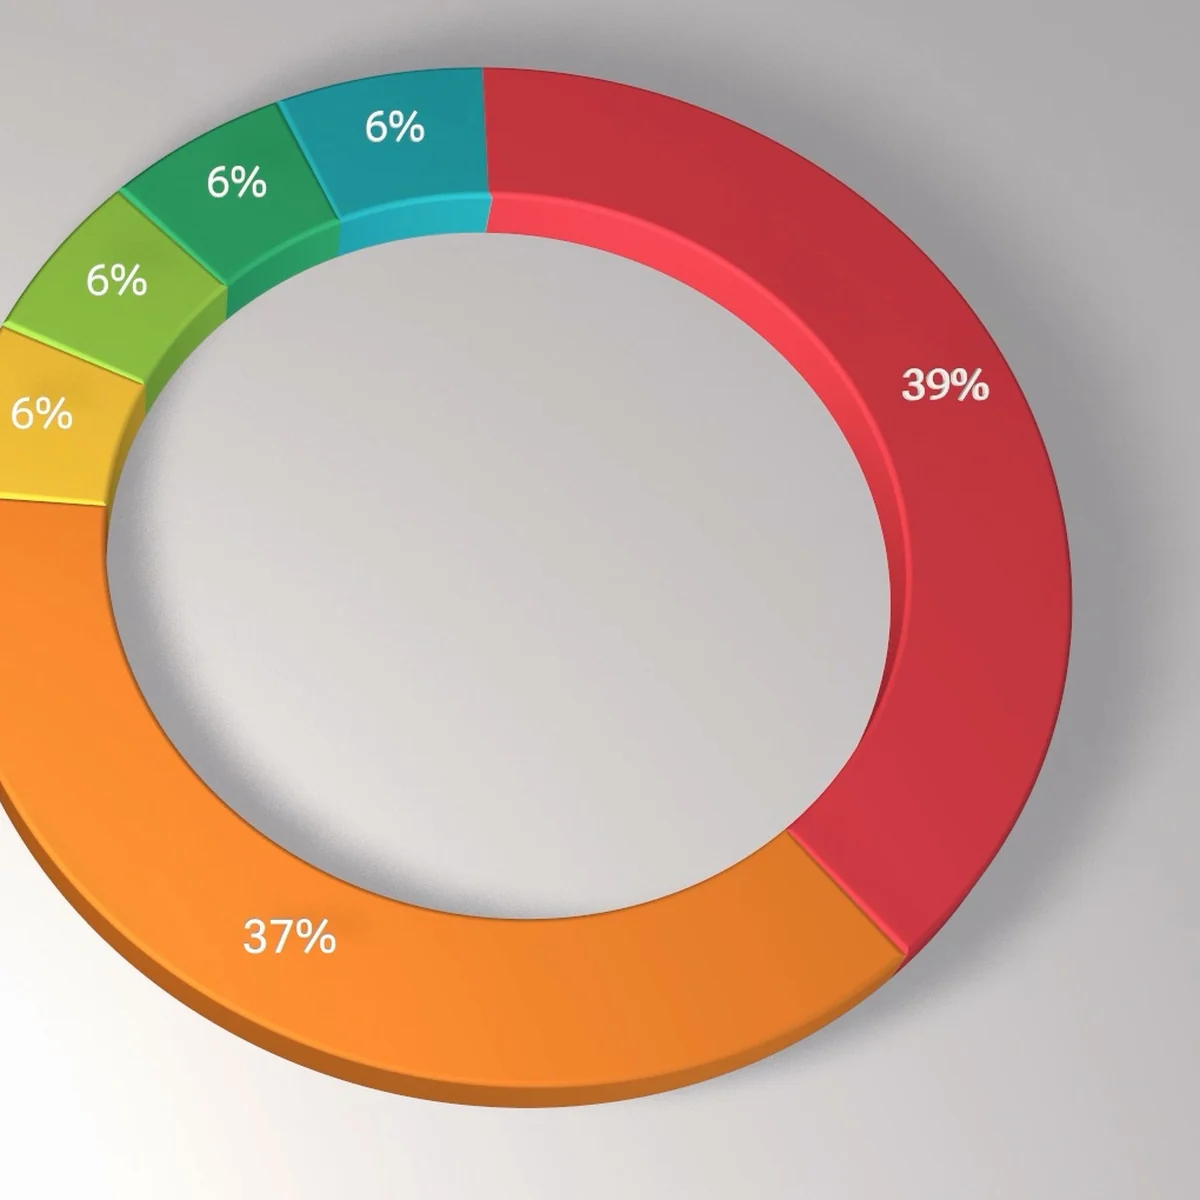
The trick that saves the most time: a slice is not a wedge to fill, it is an empty circle drawn with a thick stroke. The circle’s radius is the centreline of the ring, and the stroke width does the rest. Changing Hole Size then means changing a width, not redrawing a shape.
Pie Slice 1 · Stroke Width
// Ring thickness minus bevel on both edges, so the bevel stays inside the slice
const ctrl = thisComp.layer("Pie Controls");
const R = Math.max(0, ctrl.effect("Pie Radius")("Slider").value);
const h = R * clamp(ctrl.effect("Hole Size")("Slider").value, 0, 95) / 100;
const b = Math.max(0, ctrl.effect("Bevel Depth")("Slider").value);
Math.max(0, (R - h) - 2 * b);
The bevel is taken off both edges, otherwise it would spill out of the slice and bite into its neighbour. It is the kind of detail you don’t see until you push Bevel Depth.
The labels stay readable
Move a camera around a 3D chart and the type goes crooked. So each label faces the camera’s view direction rather than the camera itself: it stays flat, with no roll, even when the camera tilts.
Label 1 · Orientation
// Face the camera's view direction with no roll, so text stays horizontal
const cam = thisComp.activeCamera;
const dir = cam.toWorldVec([0, 0, 1]);
const p = transform.position;
lookAt(p, add(p, dir));
They also arrive at the right moment, over the last fifteen per cent of the build, and an empty slice shows nothing at all.
Label 1 · Opacity
// Fade in as the pie finishes growing; hide empty slices
const ctrl = thisComp.layer("Pie Controls");
const idx = parseInt(thisLayer.name.replace("Label ", ""), 10);
const own = ctrl.effect("Slice " + idx)("Slider").value;
const grow = ctrl.effect("Grow")("Slider").value;
own > 0 ? linear(grow, 85, 100, 0, 100) : 0;
What it doesn’t do
It needs After Effects 2027. That is the version it was built in, and After Effects will not open a project saved in a version newer than its own.
Six slices, no more. Past that a pie chart stops being readable anyway and a bar chart does the job better. The expressions run on the JavaScript engine: if your project is still on Legacy ExtendScript, switch it in File, Project Settings, Expressions.
There’s no legend and no title either. I’d rather set those by hand, they depend too much on the layout. The template takes care of the tedious part, the arithmetic and the build.
If you use it on a job, I’d like to hear about it. And if you find a case where it gets the numbers wrong, tell me in the comments and I’ll fix it.
Comments